Force plate data, made easy to understand and use.
Signal turns every jump into a clear report: what changed, how the athlete got there, and how it looks in context. Built by a coach, grounded in the science.
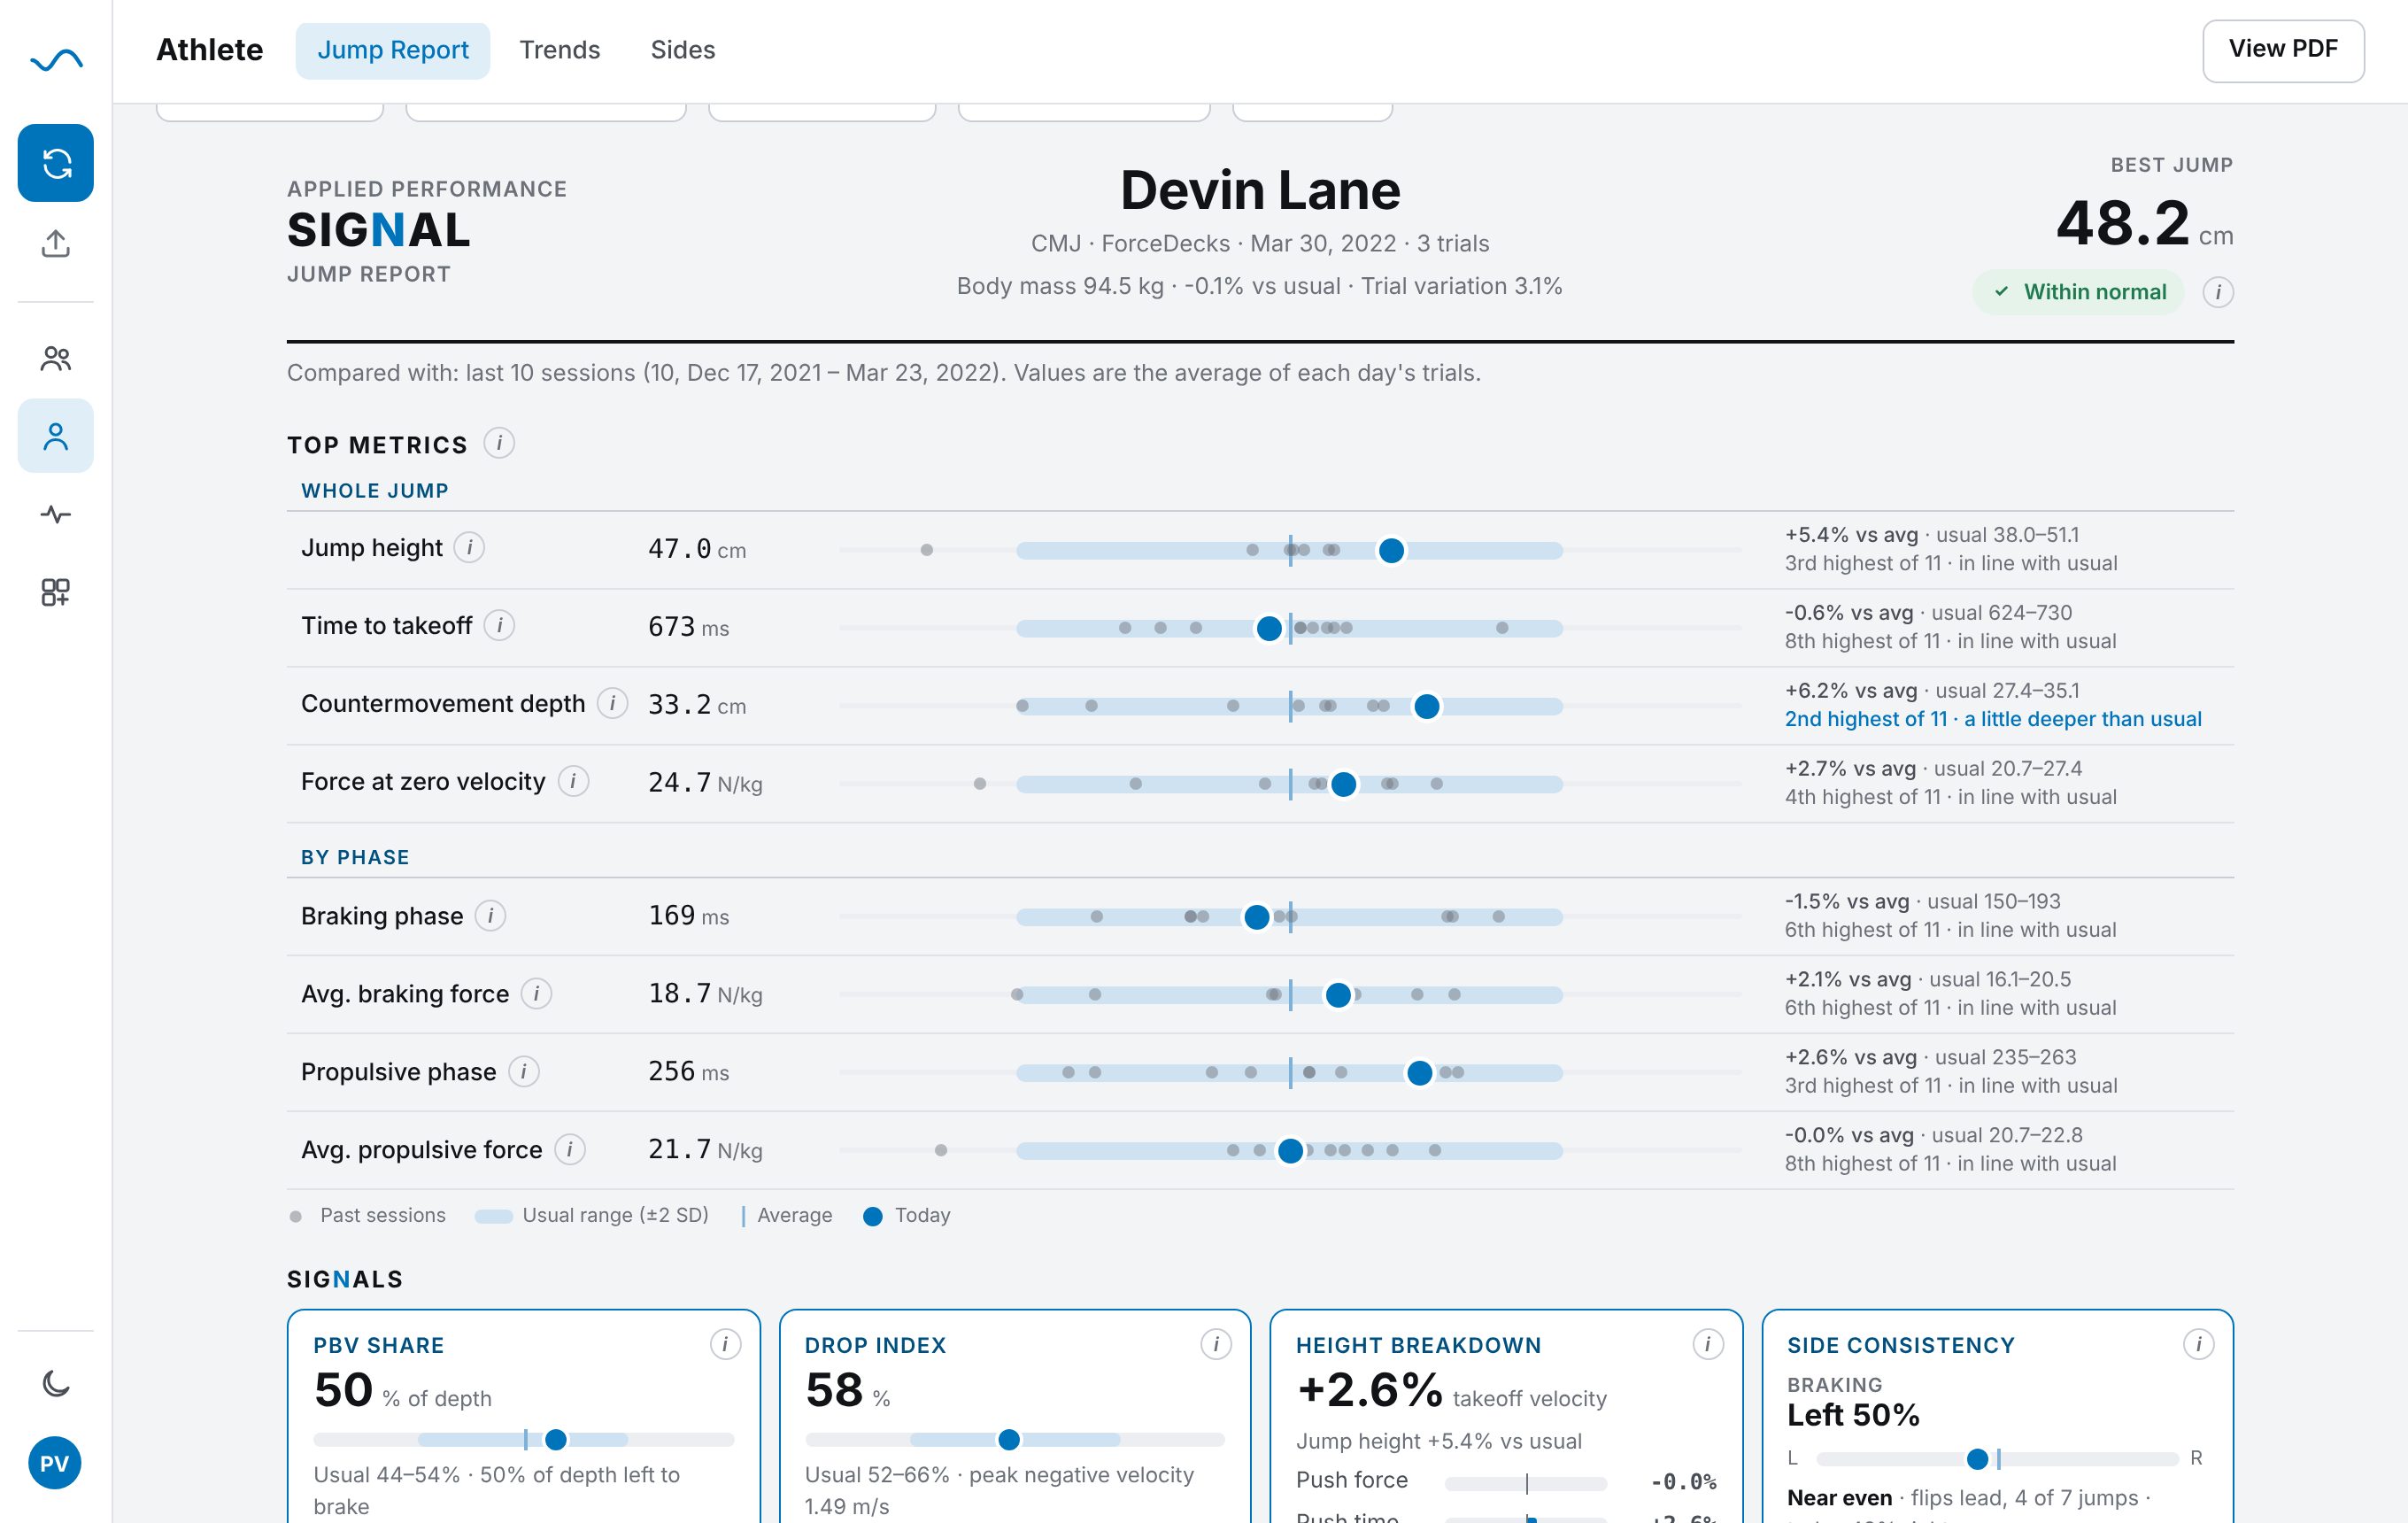
Dozens of metrics per jump. One question that matters.
A force plate hands you more numbers than anyone can use on a busy morning. What you need to know is simpler: is this athlete themselves today, what moved, and is it worth acting on. Signal answers that for every athlete, and shows its reasoning so you can trust it, question it, and explain it.
From plate to report in three steps.
Bring your data
Sync in one click, or drop in the export from your plate. Raw force-time unlocks the full picture, including the shape of every jump.
Signal adds context
Each jump is compared with the athlete's own recent test days: usual ranges, side-to-side balance and the shape of the force-time curve. Team averages add a second view when you need one.
Read it and act
One-page reports, team views and rehab tracking, with plain-language notes you can edit and PDFs you can share with staff.
One place for the whole roster.
Team, athlete and rehab views, all built on the same science, and every metric expressed relative to body mass so athletes of every size compare fairly.
Every jump, compared with context.
See each metric next to the athlete's usual range, how today ranks among their recent jumps, and what drove the change. Their own normal comes first, the team average is a click away, and comparisons with normative data are on the way.
- Trends with a usual range that moves as the athlete adapts
- Jump Signature: today's force-time curve against their usual shape
- Coach's Take, drafted for you and fully editable
- Hover any metric for a plain-language definition
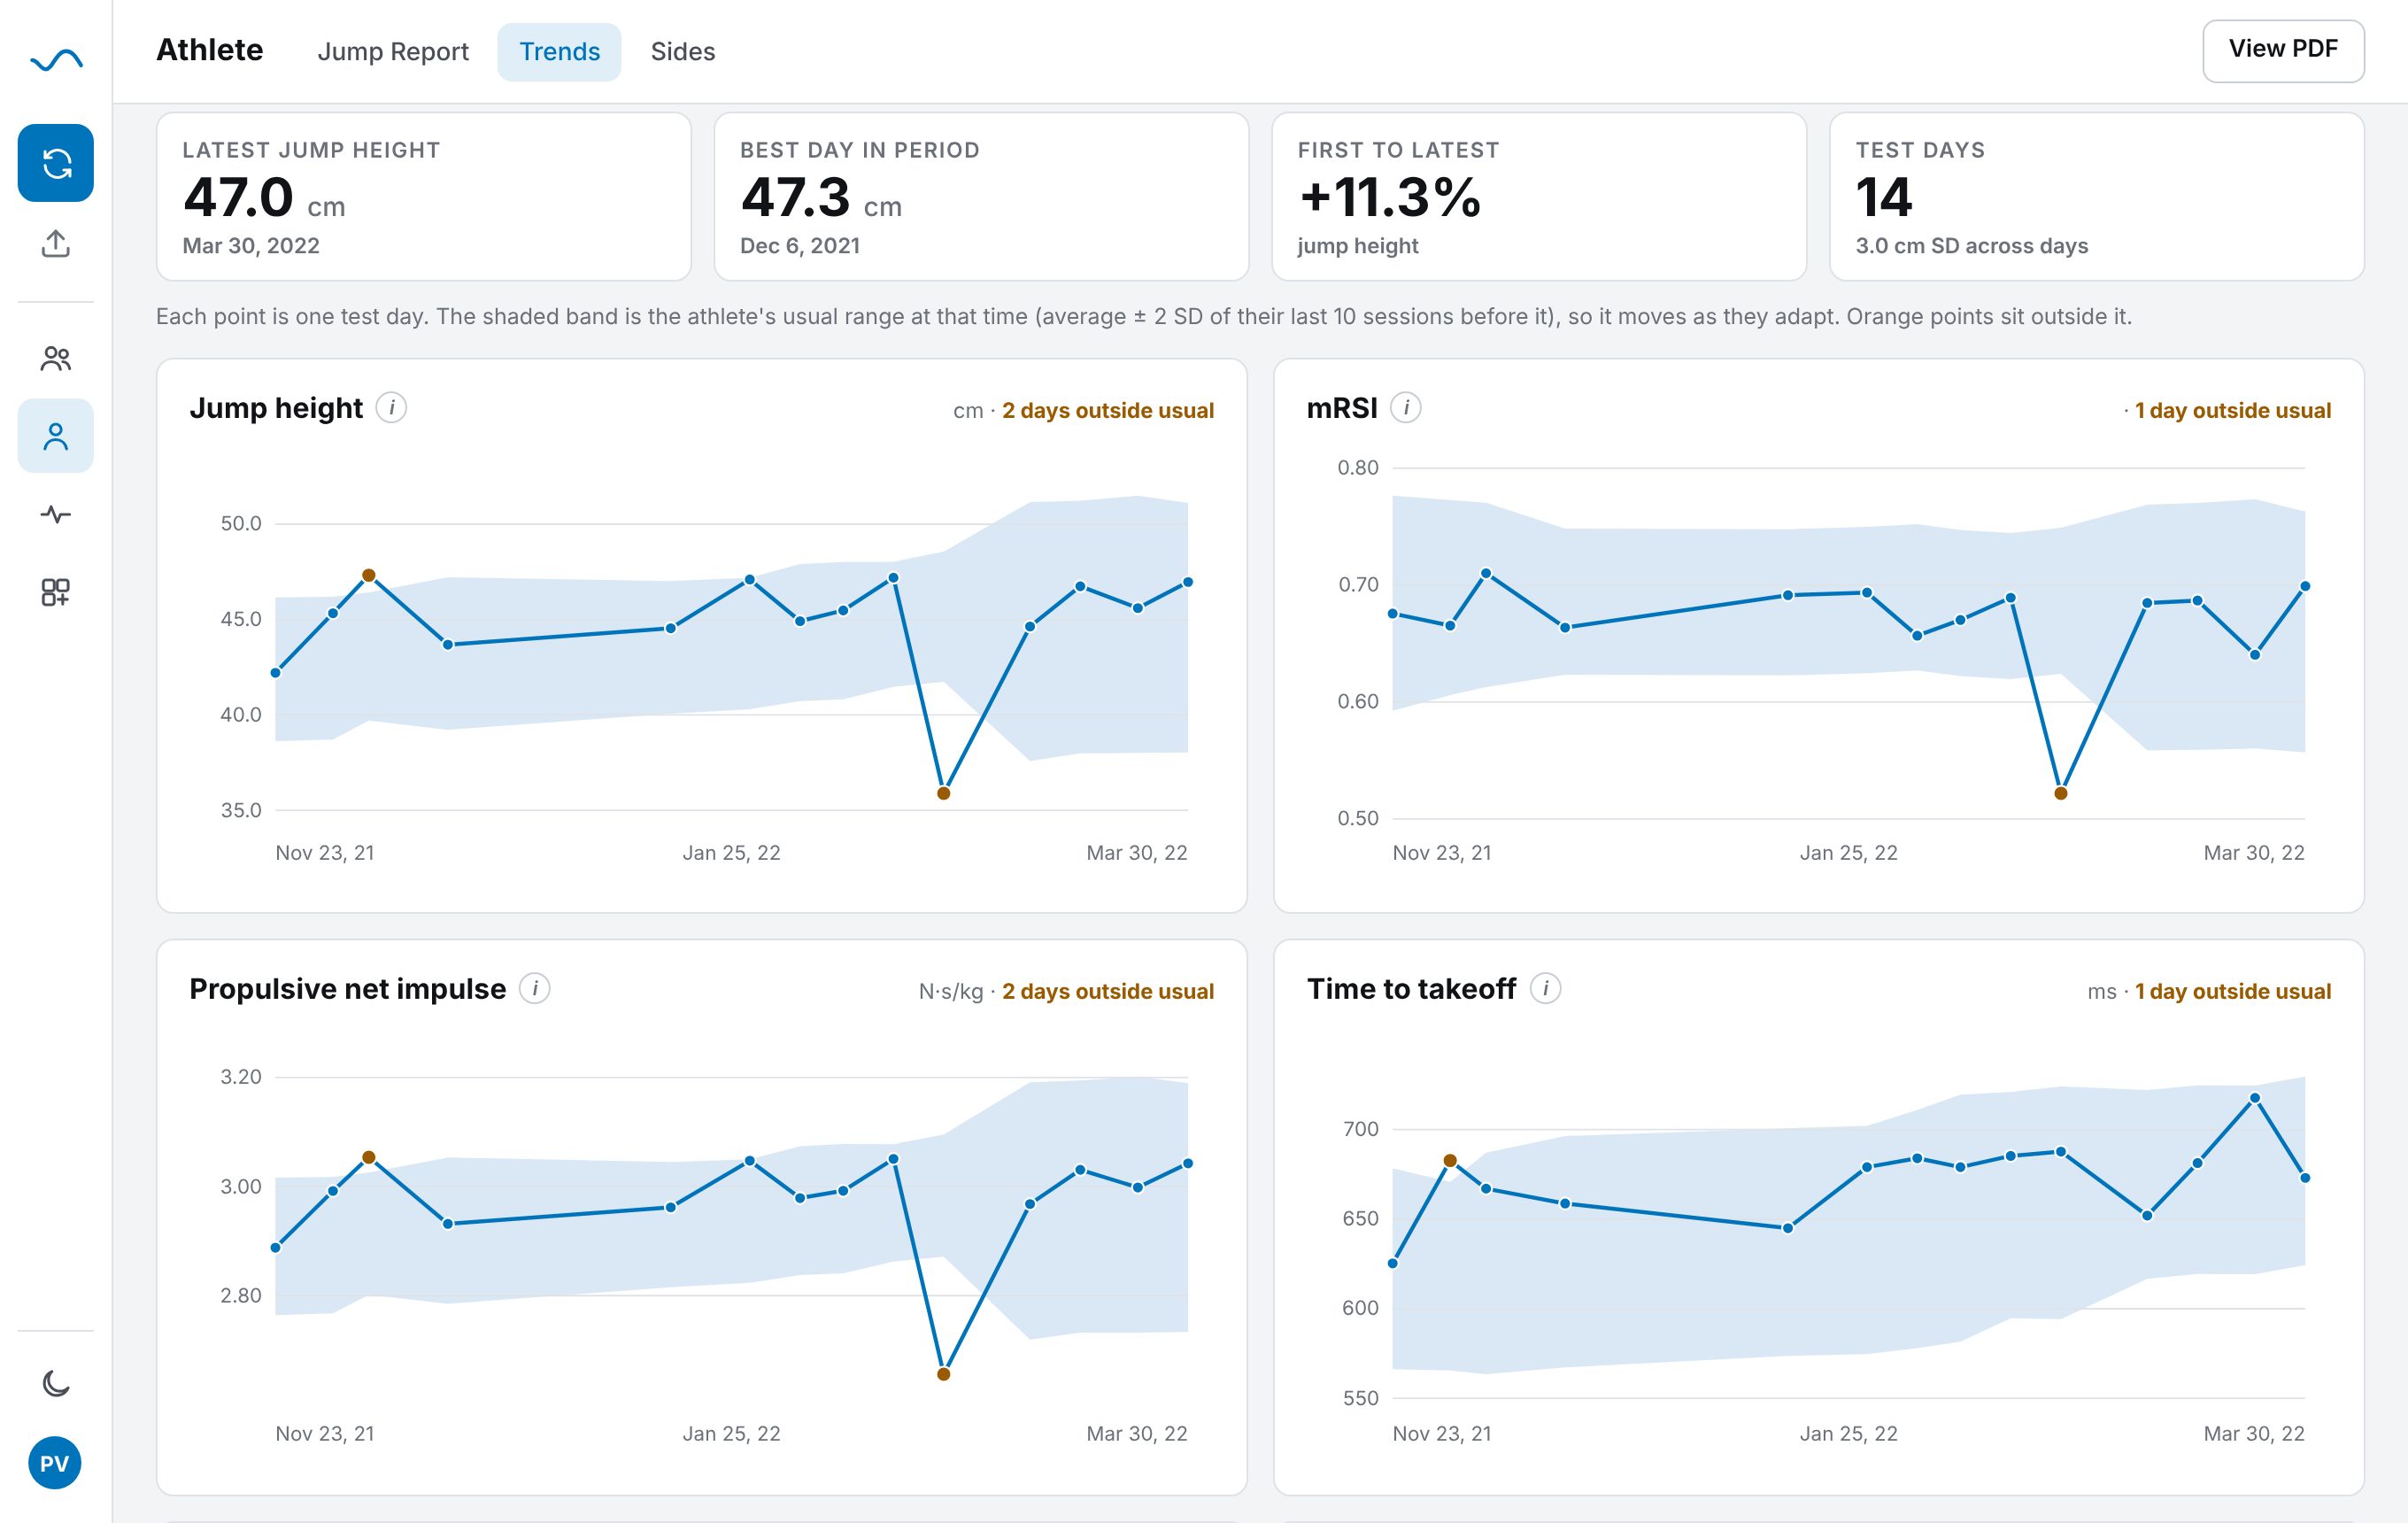
Know who needs a closer look in seconds.
Everyone who tested today, sorted so the athletes outside their usual range come first. Click any row for the full report.
- Rankings and team trends over the season
- Compare an athlete with the team average when you need context
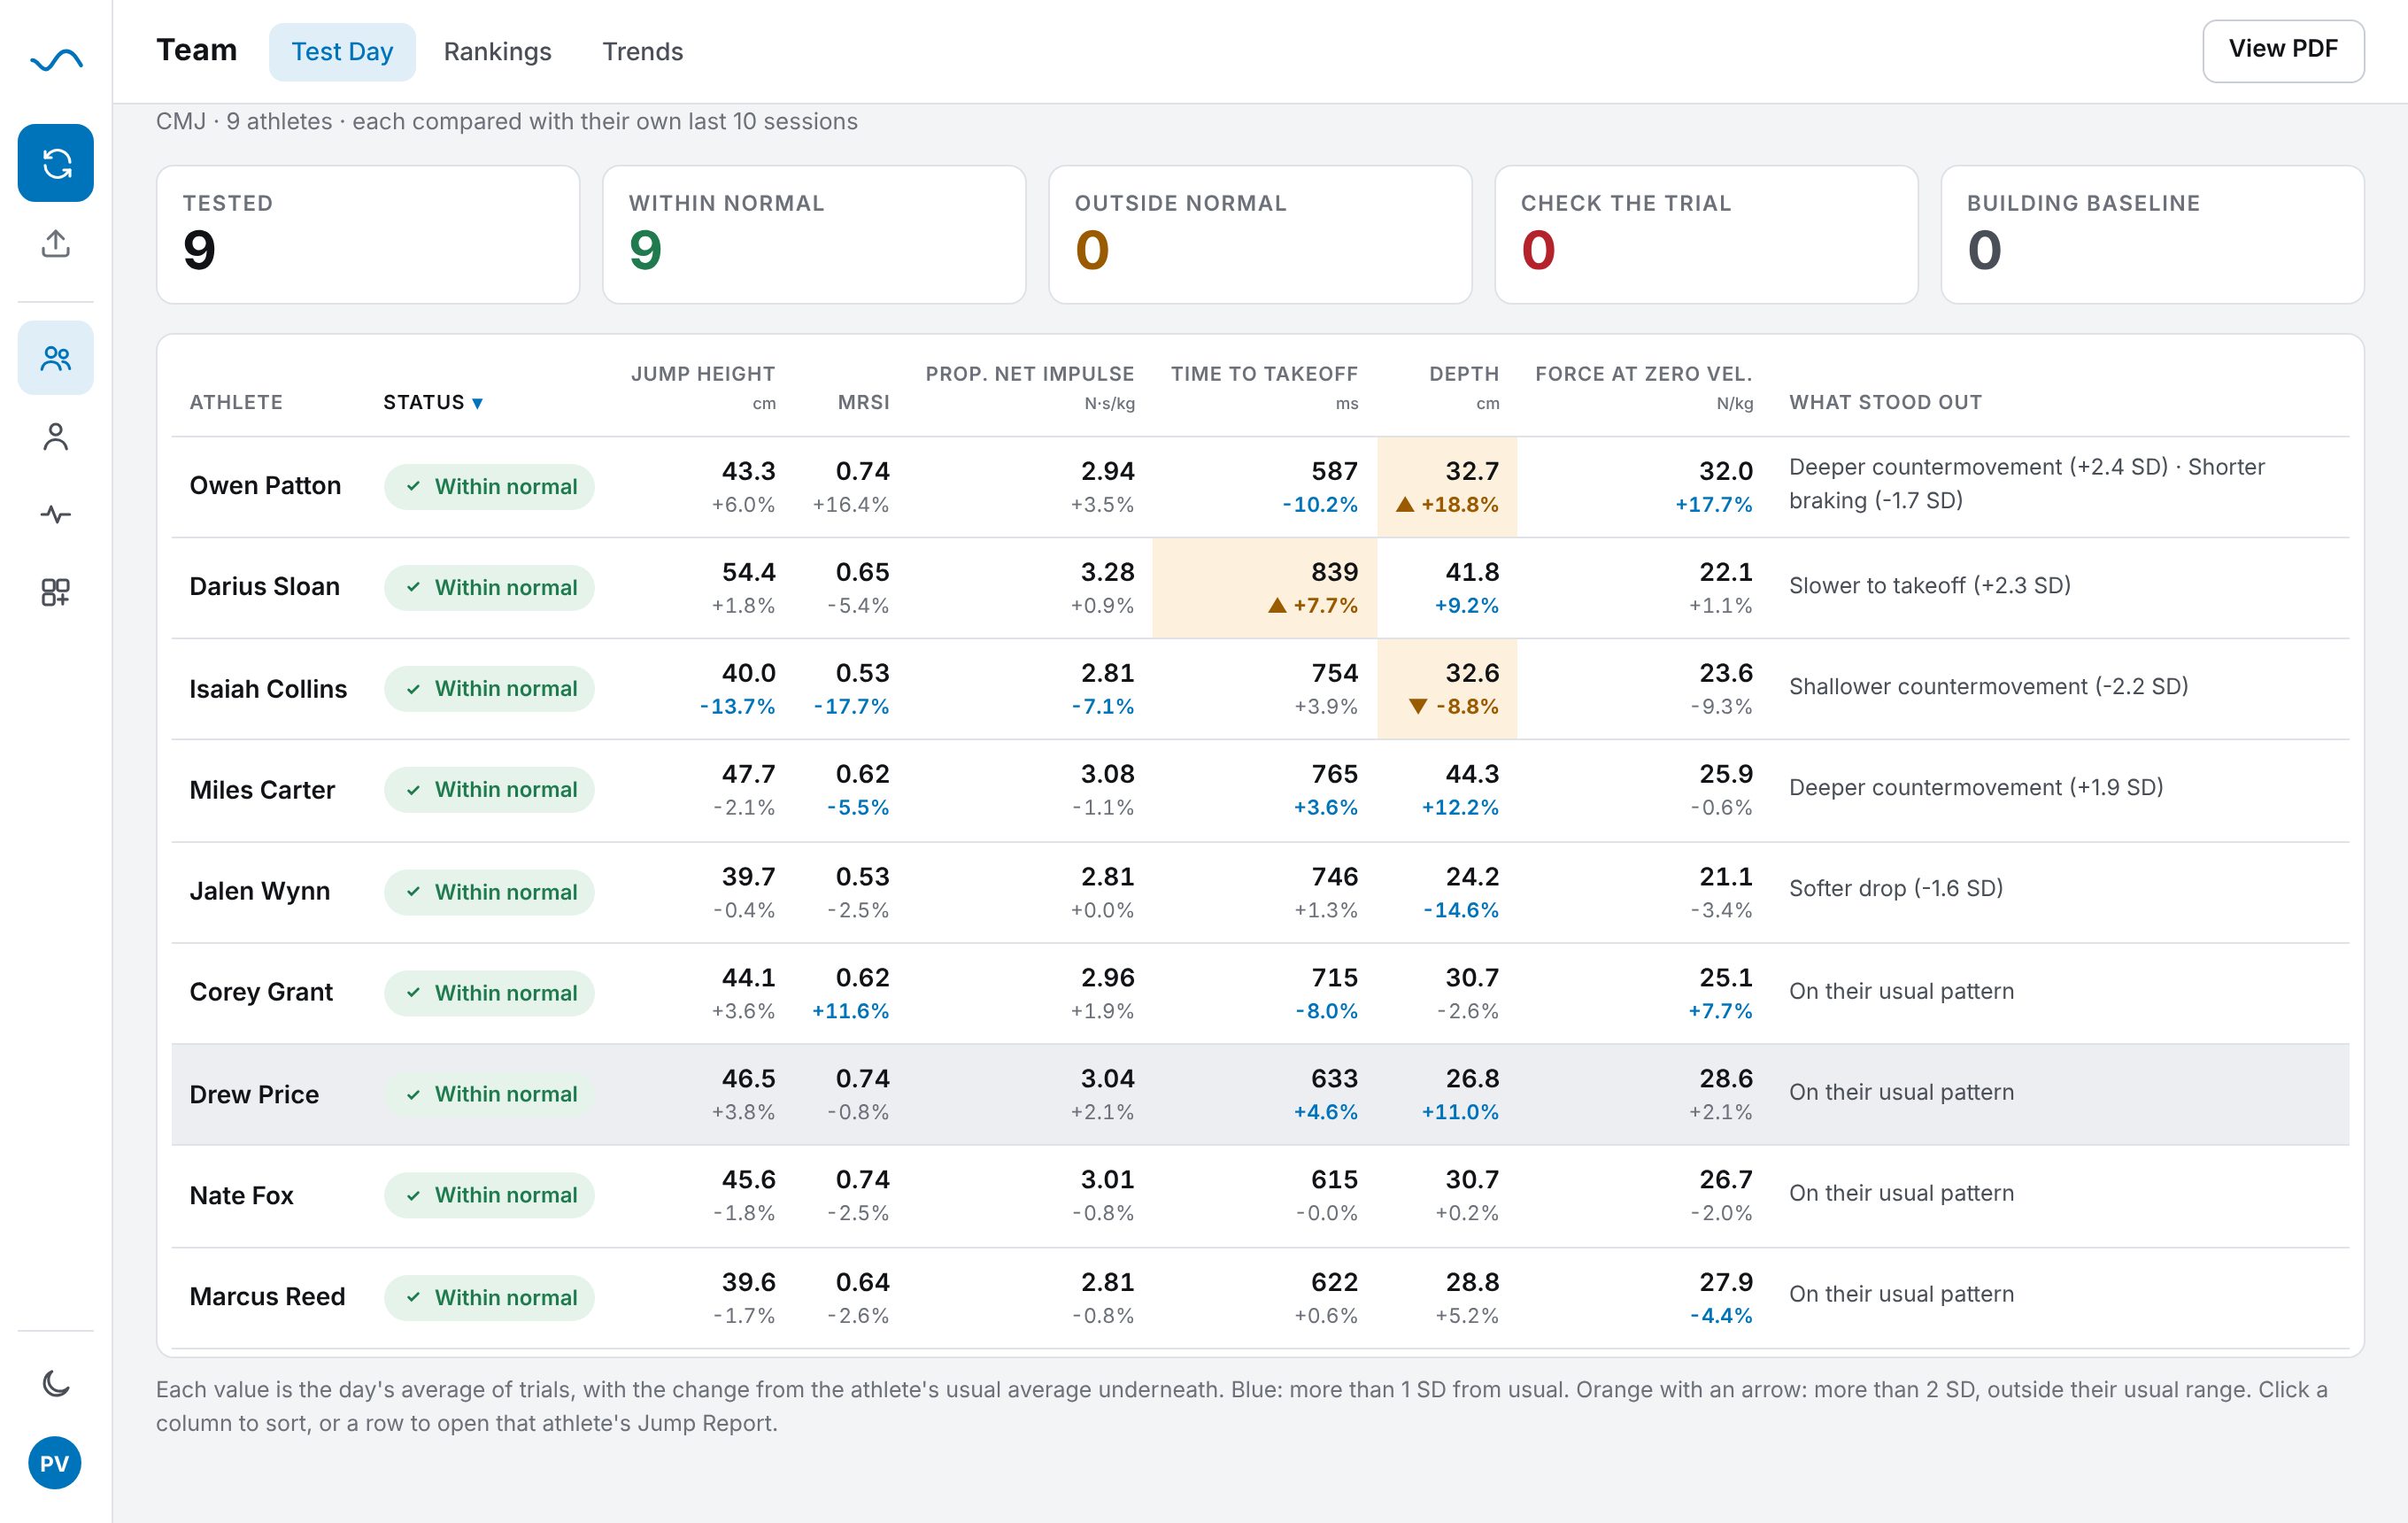
Left and right, with context.
Side-to-side splits for braking, propulsion and landing, how consistent the lean is, and whether today moved away from the athlete's usual split.
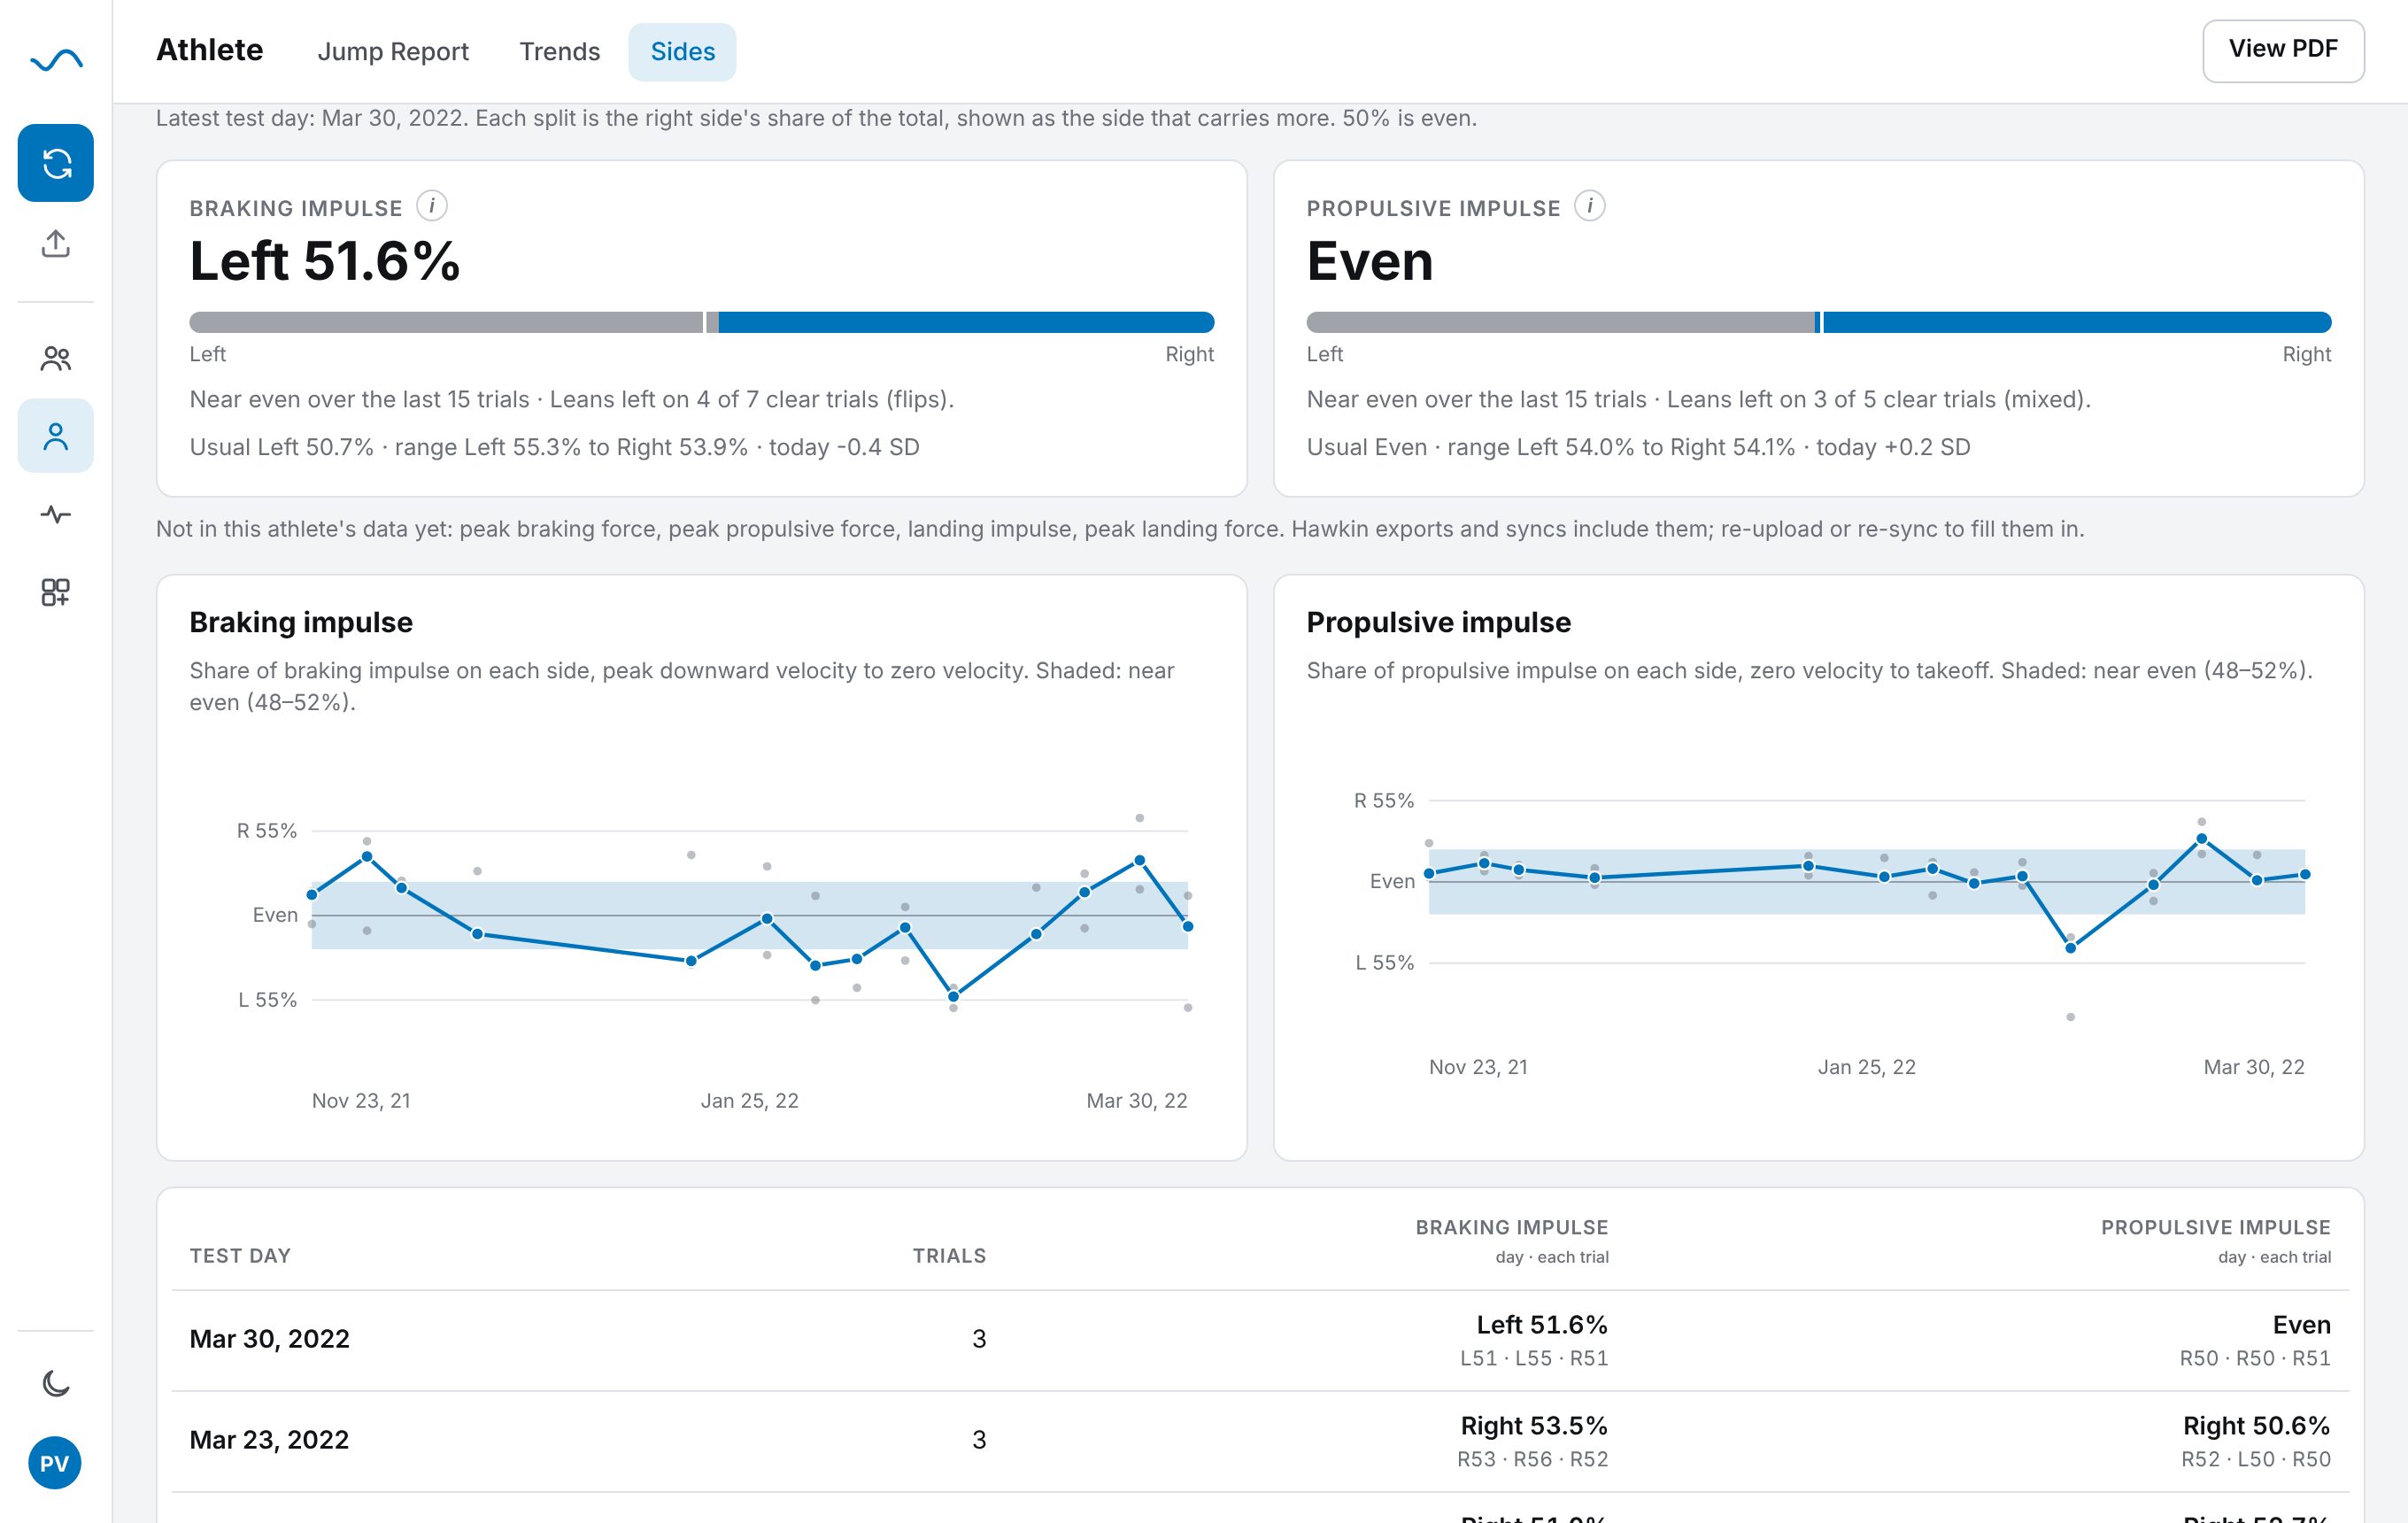
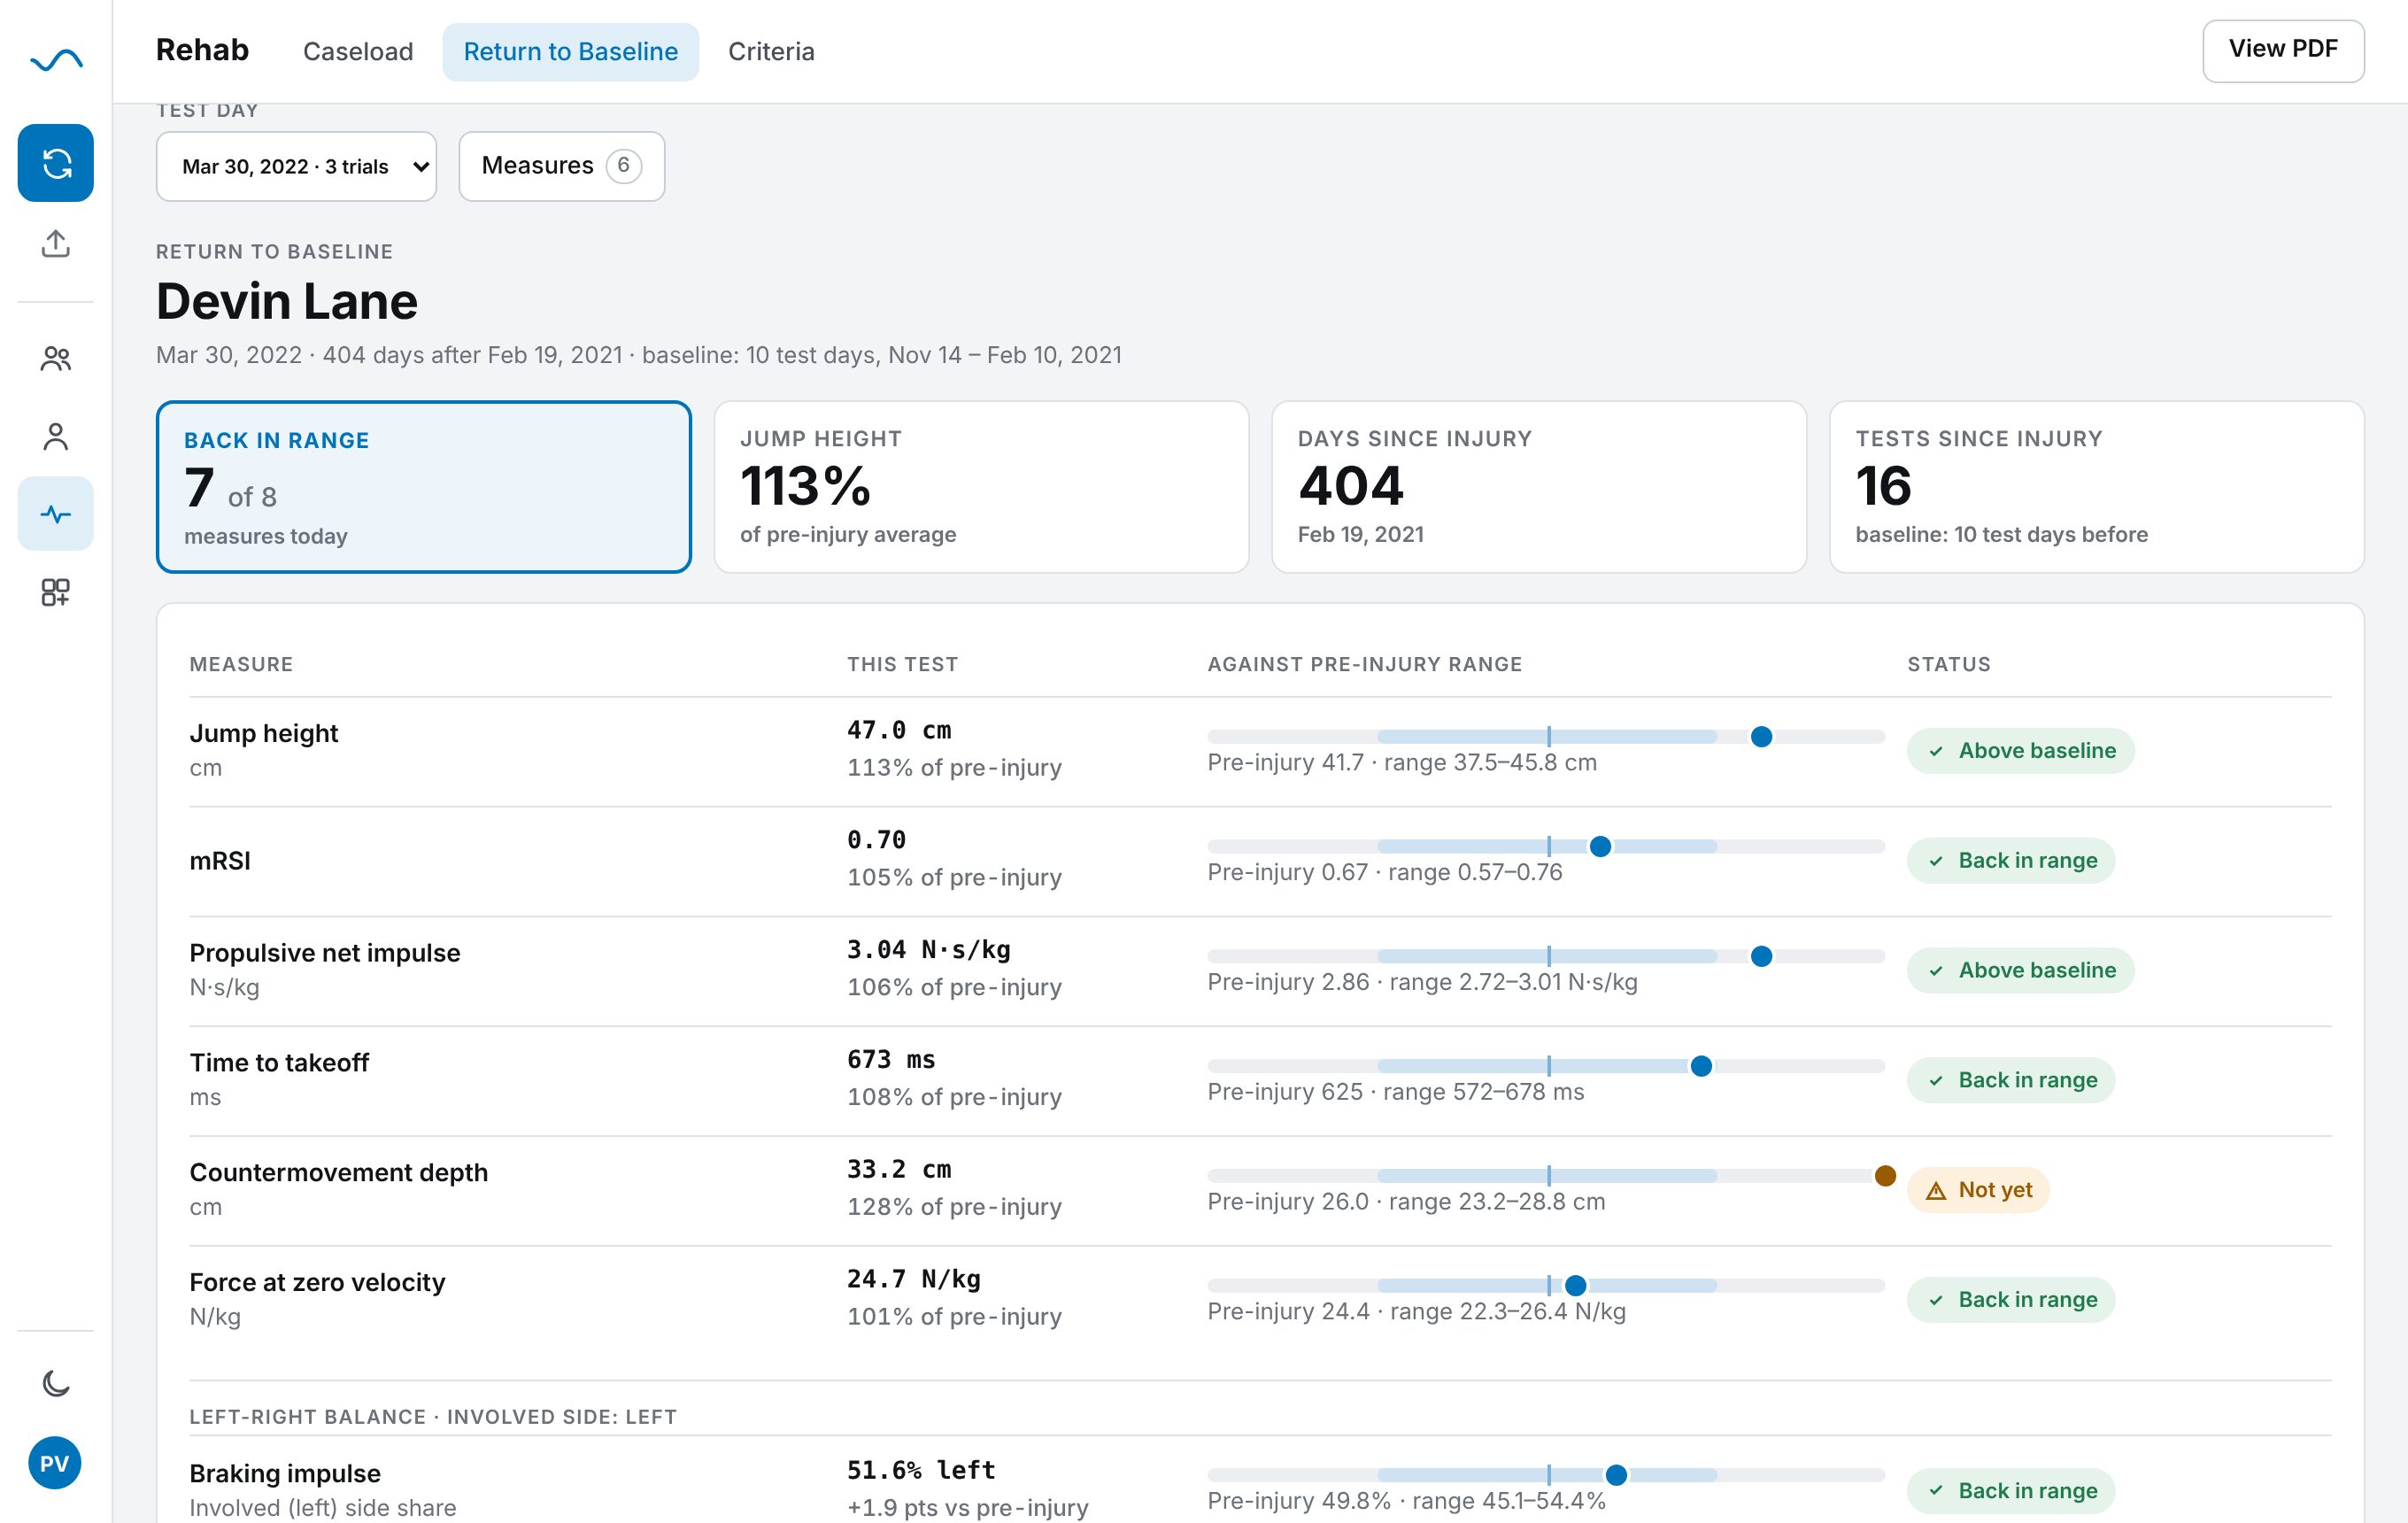
Track the way back against their own pre-injury self.
Set the injury date and Signal compares every test after it with the athlete's own pre-injury days. Your staff set the return criteria, and Signal tracks them test by test.
- Signature progression: watch the movement strategy come back
You bring the data. We'll make it easy to understand.
Upload the export from your plate, or sync in one click. By default, Signal uses your plate company's own metric equations, so the numbers match what you already see in their software. When a file only has raw force-time, Signal calculates the metrics itself, and raw data always adds the shape of every jump.
We never see your athletes' data.
Runs in your browser
Signal does every calculation on your computer. Athlete data is stored there, in your browser, and is never sent to Applied Performance.
Your account is just you
Your account holds your name and email so you can sign in. Nothing about your athletes is attached to it.
Easy to clear, easy to back up
Download a backup file whenever you like, and delete everything in one click. Read the privacy policy.
Made by a coach who lives in this data.
Signal is built by Ramsey Nijem, ScD, Director of Sport Performance for Kansas Men's Basketball and former Head Strength & Conditioning Coach for the Sacramento Kings. It comes from years of turning force plate data into decisions with real athletes, and it teaches the way Applied Performance does: simple on the surface, rigorous underneath.
Questions coaches ask.
Which force plates work with Signal?
Any plate that exports your data. Upload the export file, or sync in one click where your system allows it. Signal uses your plate company's metric equations by default, and raw force-time files add Jump Signature and the force-time curves.
Where is my athletes' data stored?
In your browser, on your computer. Signal never sends it to Applied Performance. Your account only holds your name and email.
Do I need to install anything?
No. Signal runs in Chrome or Edge on a computer. One-click sync uses a small free browser extension, Signal Sync, which you add once.
How do I get access?
Join the waitlist. We're opening the beta to coaches in waves, and we'll email you when your spot opens.
Can I use it on my phone?
Reports read well on a phone. Syncing and uploading work best on a computer.
What jumps does it handle?
Countermovement jumps today. More tests are on the way.
See your athletes clearly.
Join the waitlist and we'll let you know when your spot in the beta opens.